Results

We are researching that.

Current results and interim results from MCube MOSAIQ

In MOSAIQ, we collect data using a mix of methods through surveys, counts, and by observing participation around implementation, and then analyze it. In addition to classic research methods, we also use participatory formats where everyone can contribute.


We carefully evaluate the data collected in this way using scientific methods and gain insights from it. We share the results with you. We also bring important findings directly back to the neighborhood, for example at exhibitions or discussions where we mirror the results with the personal impressions of local people. Other evaluations require more time.

On this page, you will always find insights into results and current interim statuses from MCube MOSAIQ.

On-site interim reports in the neighborhood

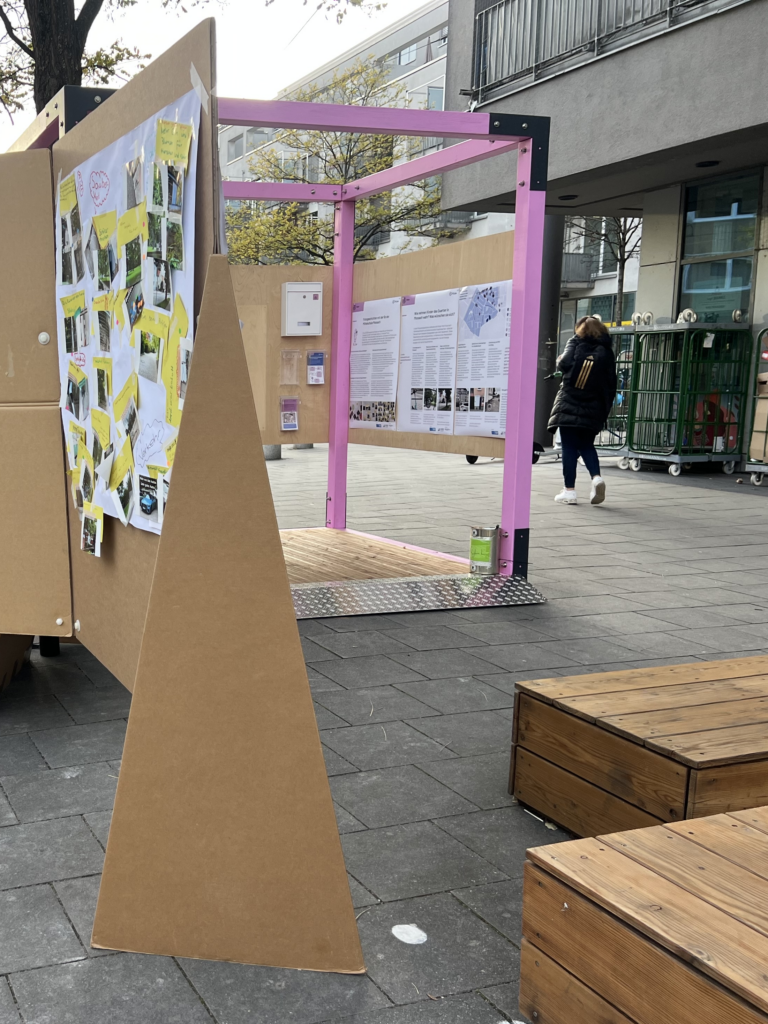
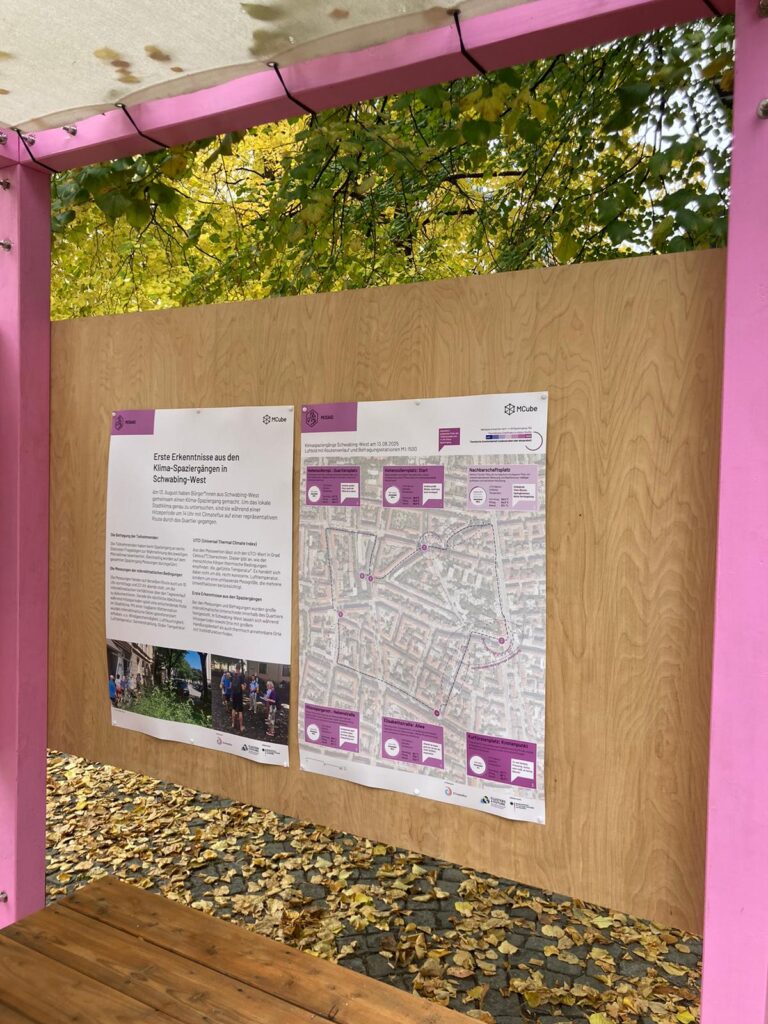
Neighborhood exhibitions
at the dialogue points

We present selected insights from MCube MOSAIQ as small neighborhood exhibitions at our dialogue points within the neighborhoods. In the area of Events Let us know when a new exhibition starts!

Report series on current findings

Series "Mobility and Urban Climate"

In the series „Mobility and Urban Climate,“ research and teaching results related to MCube MOSAIQ are presented to the interested (professional) public. Here are the latest issues:

Series No. 1
Information and facts about MCube MOSAIQ

Series No. 2
Climate Walks 2025. Explanations of results in MCube MOSAIQ

Series No. 3
Pre-survey 2025. Methods and initial results of the neighborhood survey in MCube MOSAIQ

Initial results clearly presented

Interactive map

You can discover some of our current results directly on the interactive map here.

The map is currently being revised and will be updated step-by-step. 

Soon you can see the results of the climate walks and photo stories there again. Click here, to view the map in full screen.

The Climate Walks took place in August 2025 – during a heatwave with very warm days and, at times, tropical nights. In the early afternoon (2 PM), residents, together with Climateflux, examined the local urban climate in both neighborhoods. The highest temperatures are usually measured in the early afternoon. Measurements were taken using a portable weather station. Among other things, air temperature, humidity, solar radiation, and wind speed were measured. The UTCI value (Universal Thermal Climate Index) in degrees Celsius (°C) can be calculated from the measured values. The UTCI indicates, as an equivalent temperature, how the human body perceives thermal conditions. Furthermore, surveys documented the effects of the specific climatic conditions on the participants. To understand the daily progression of thermal stress, measurements were taken at two other times of day: in the morning (10 AM) and in the evening (10 PM). The city heats up in the morning. In the evening, it becomes visible how much and where the city cools down again.

The individual stops of the walks and measurements are marked on the map. For each point, the measured UTCI value (at three times of day) and brief participant assessments of thermal comfort (in the early afternoon) can be displayed. A detailed report on the background of the research format and the measurements can be found in the series „Mobility and Urban Climate,“ No. 2.

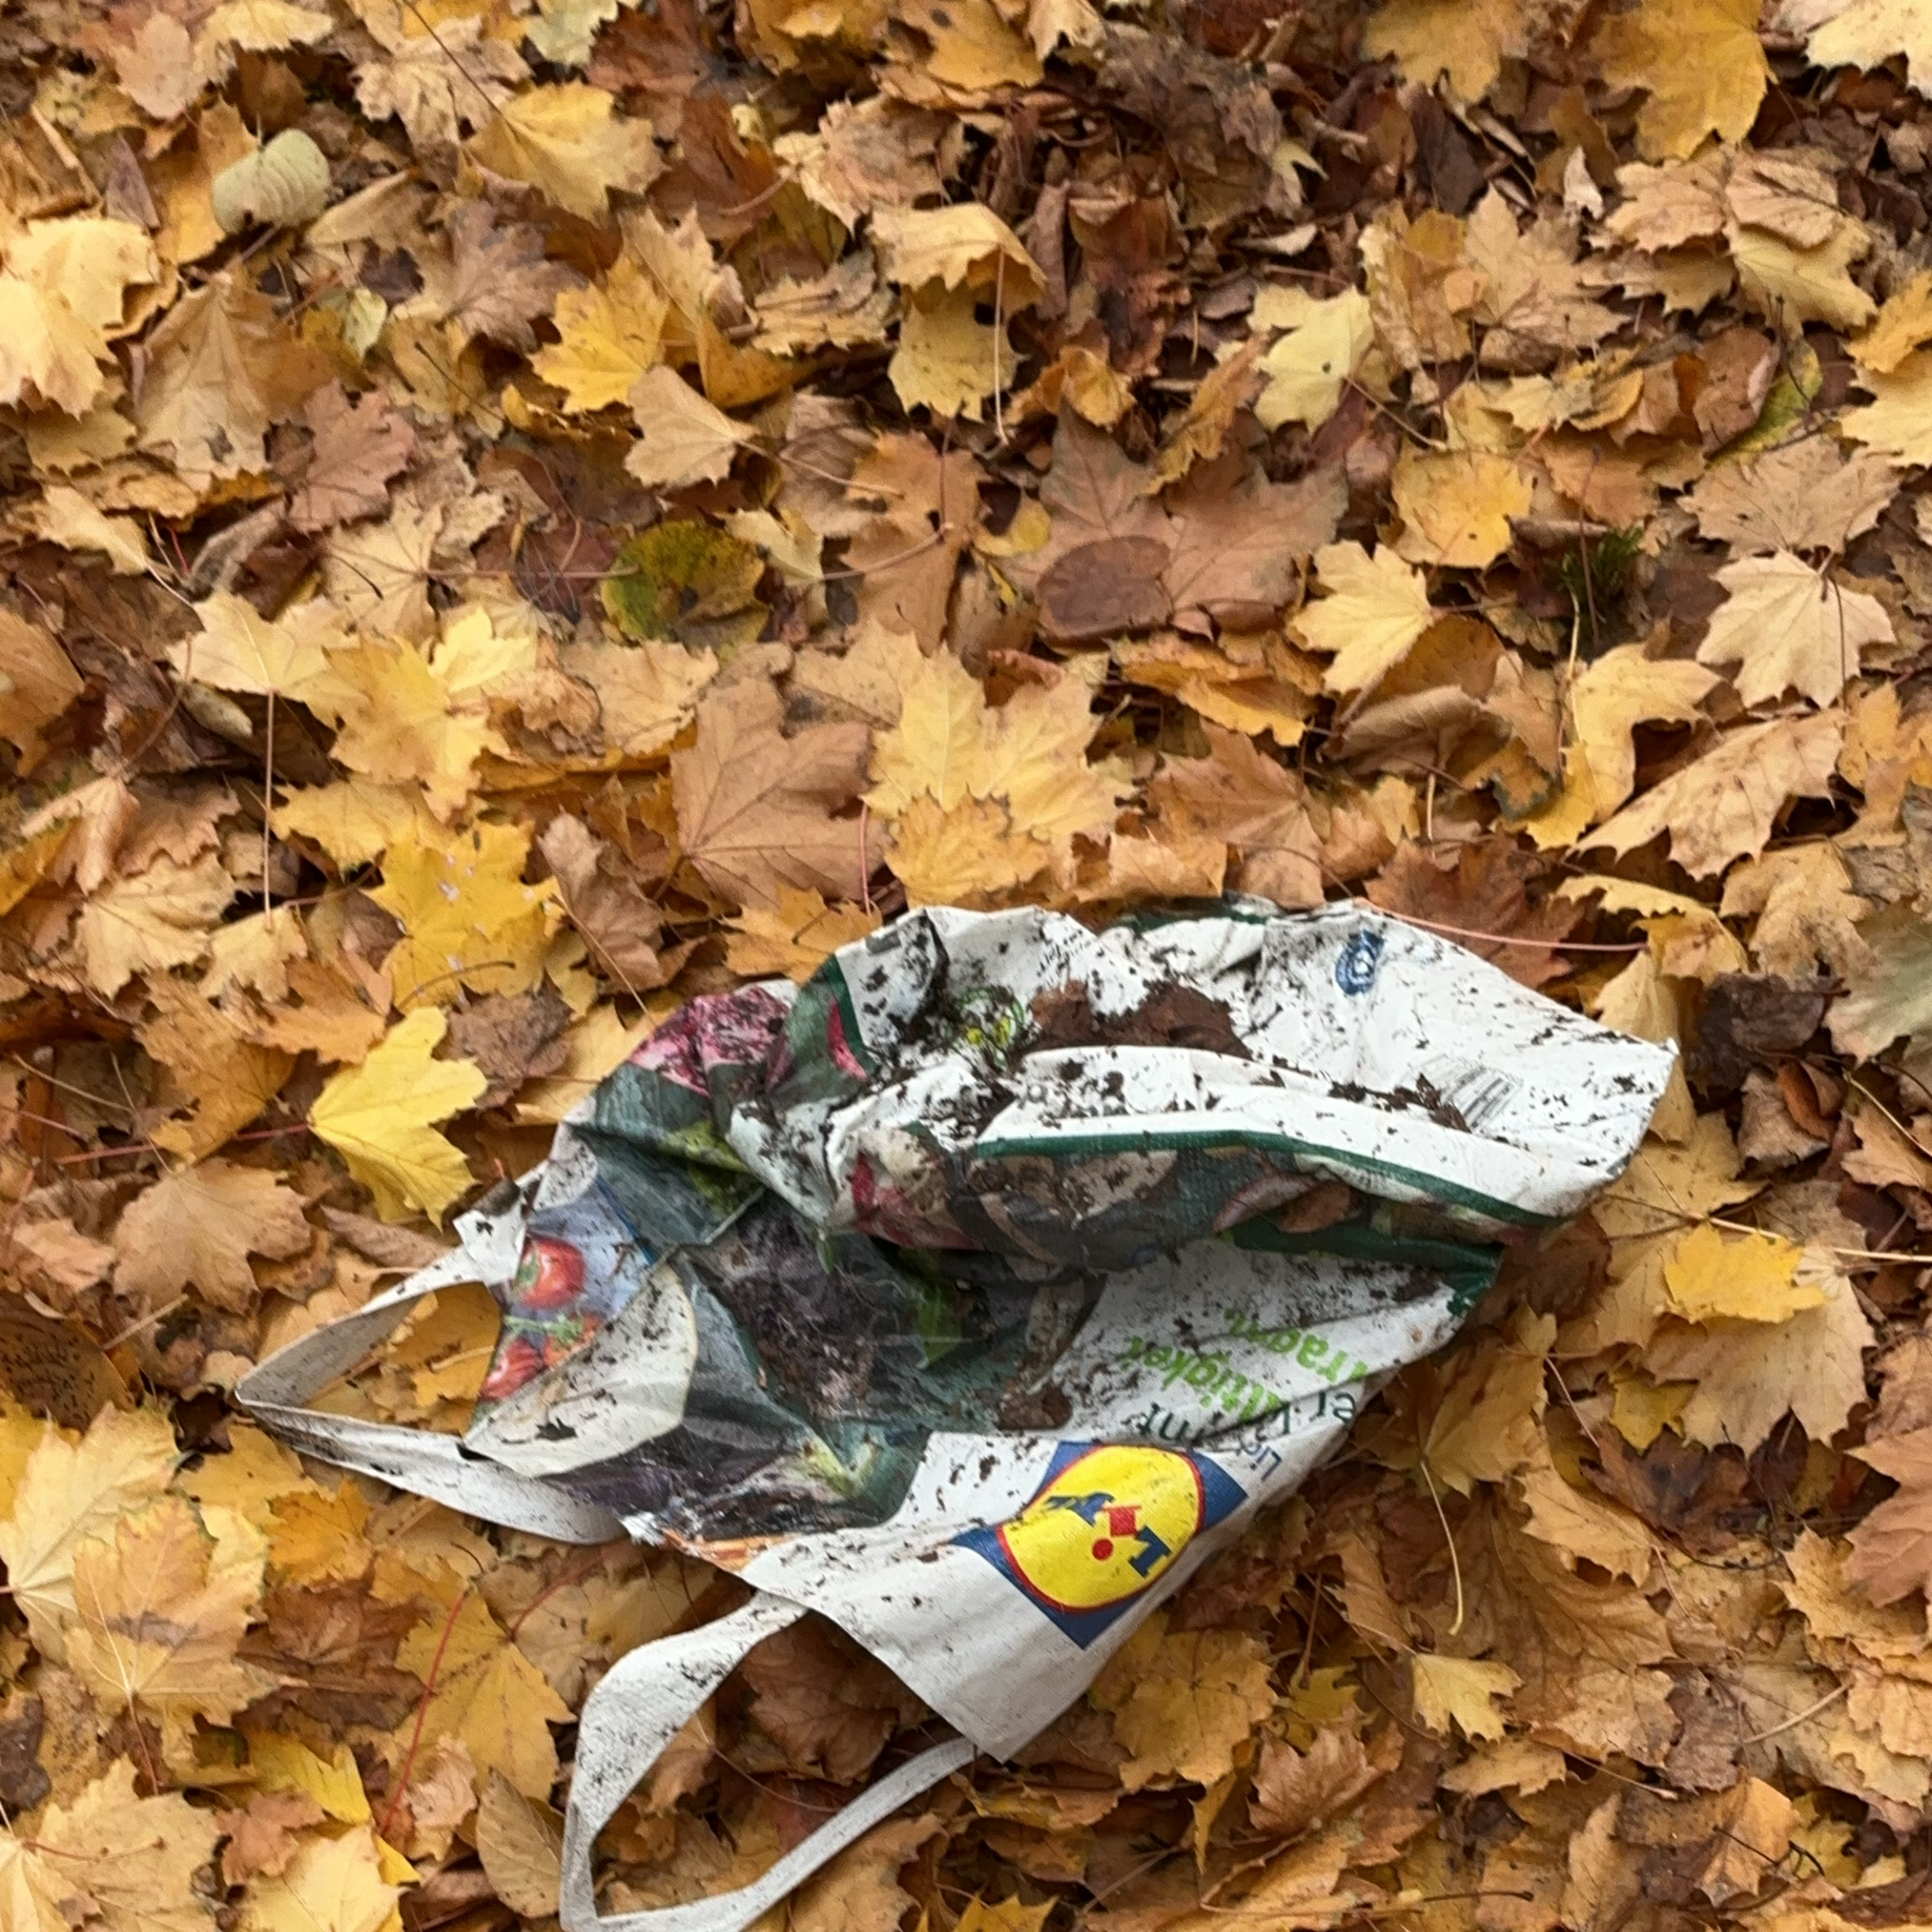
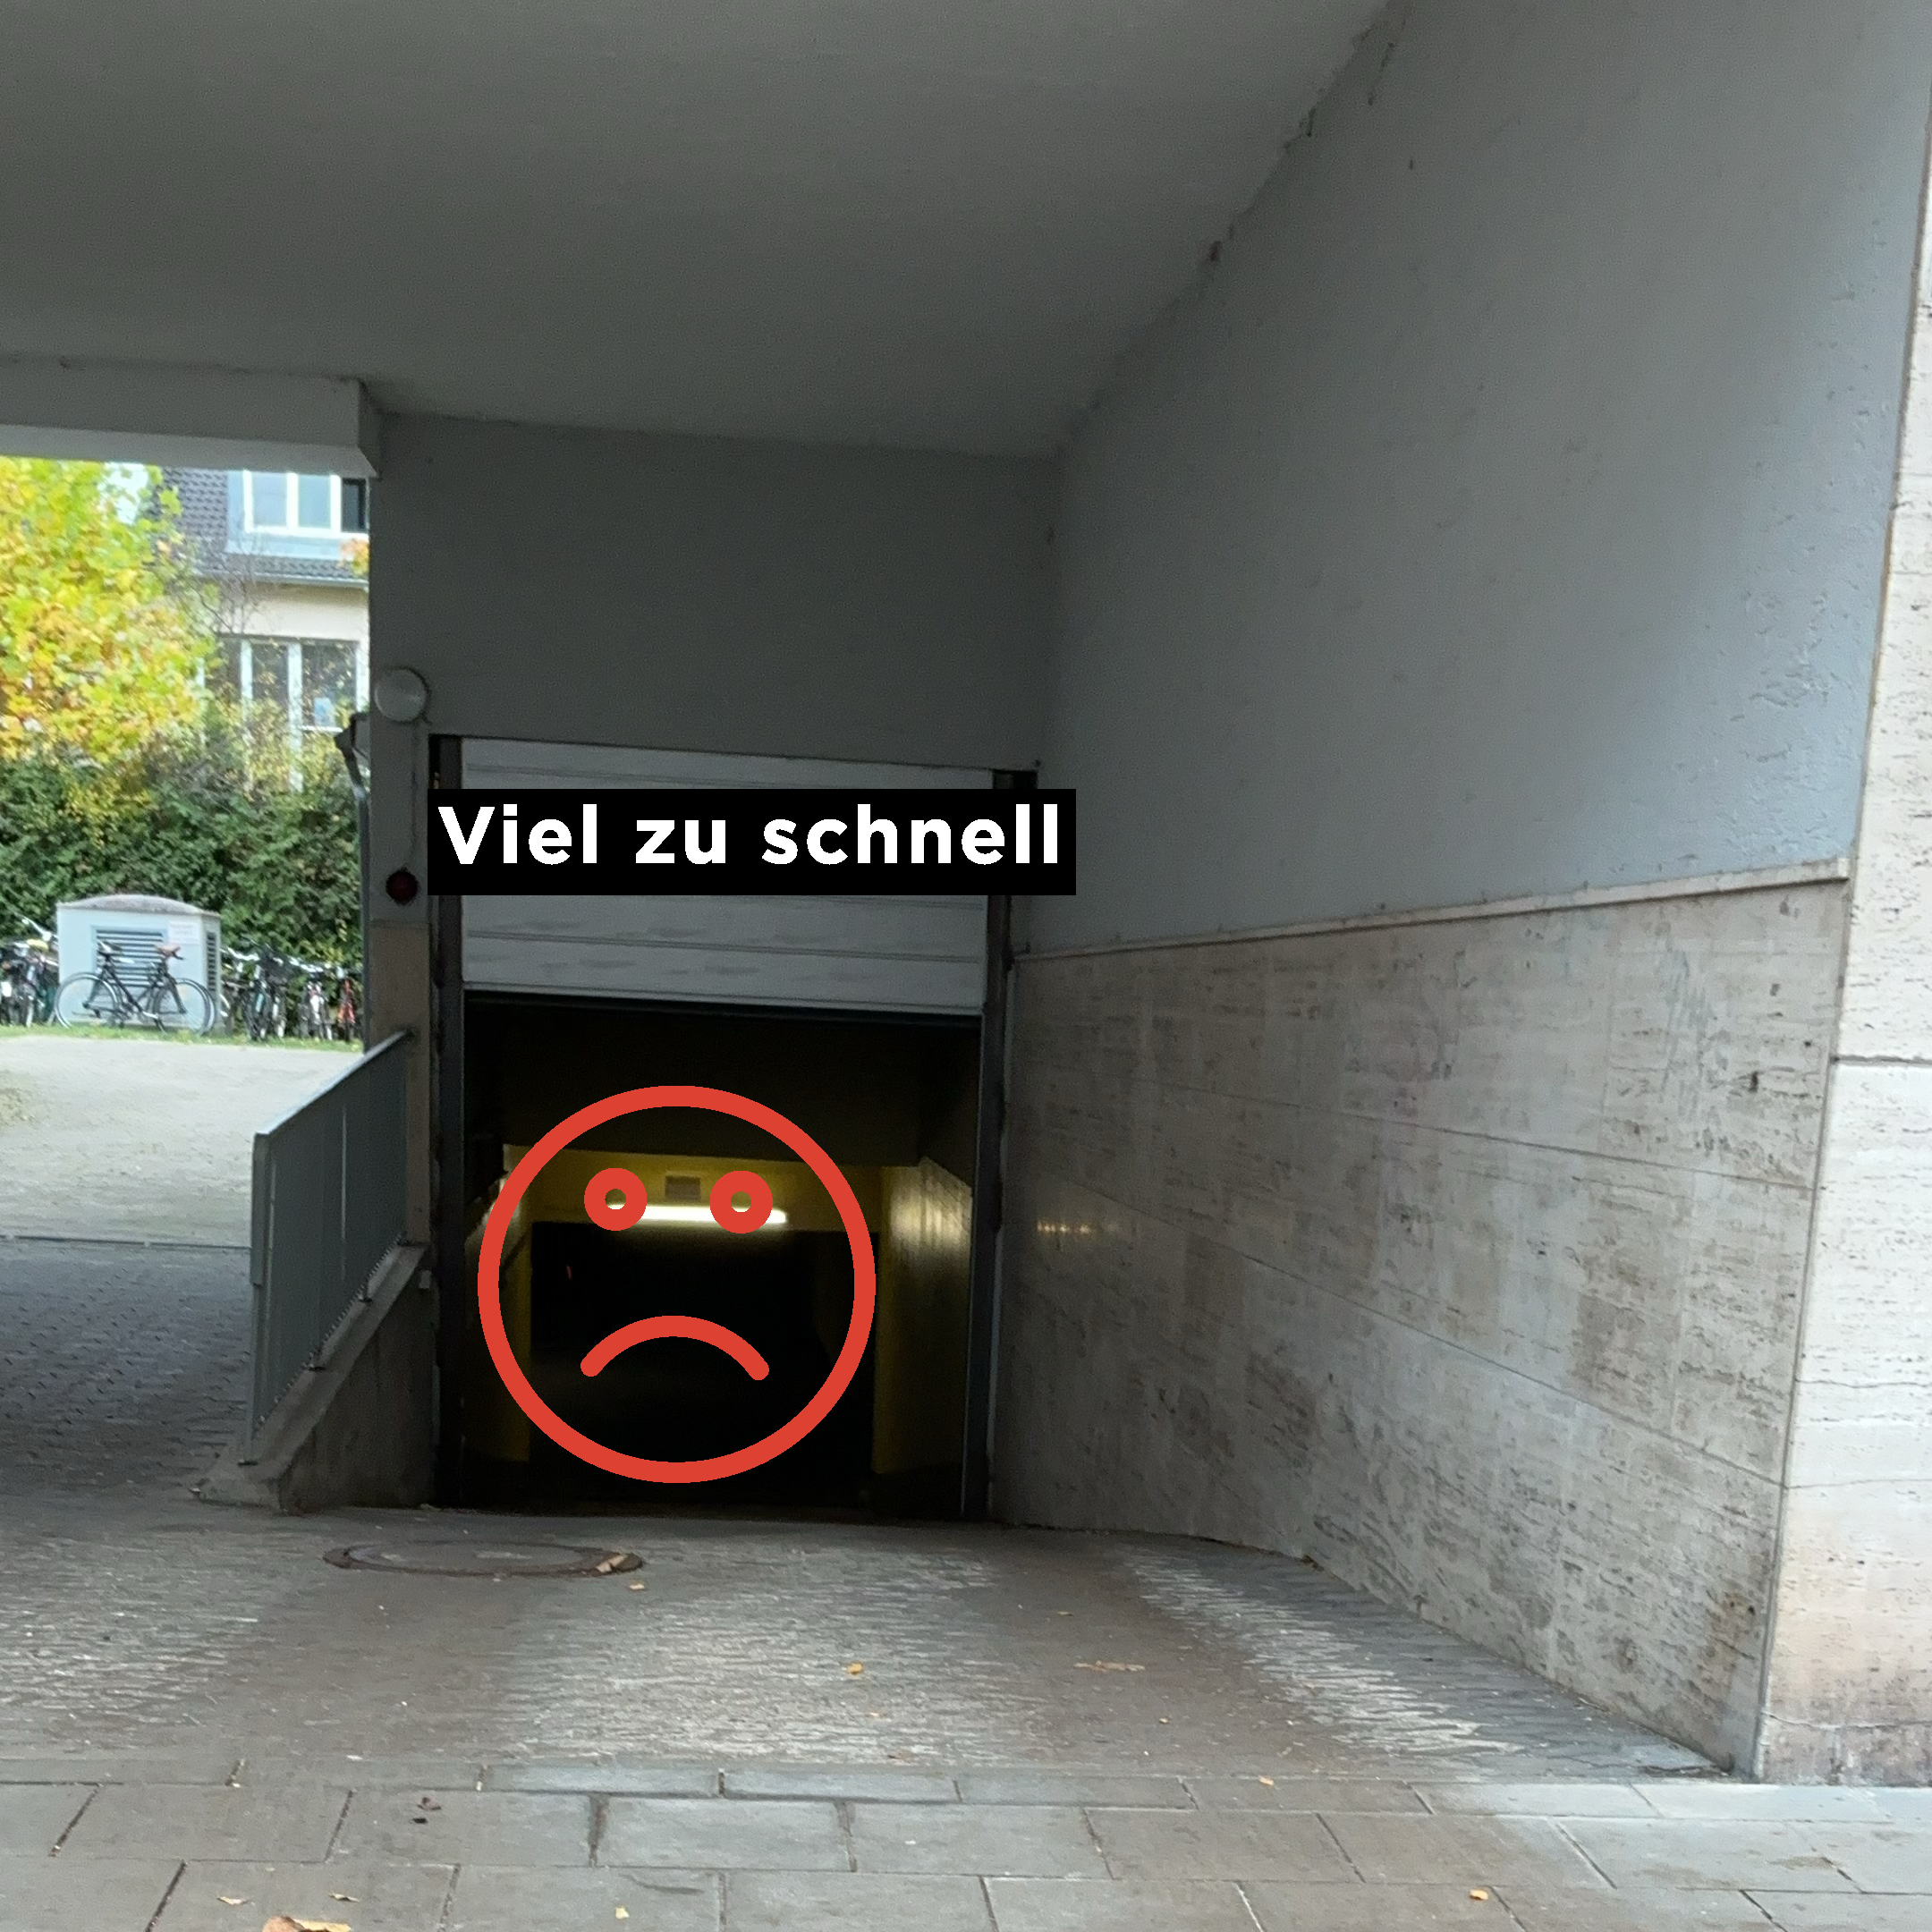
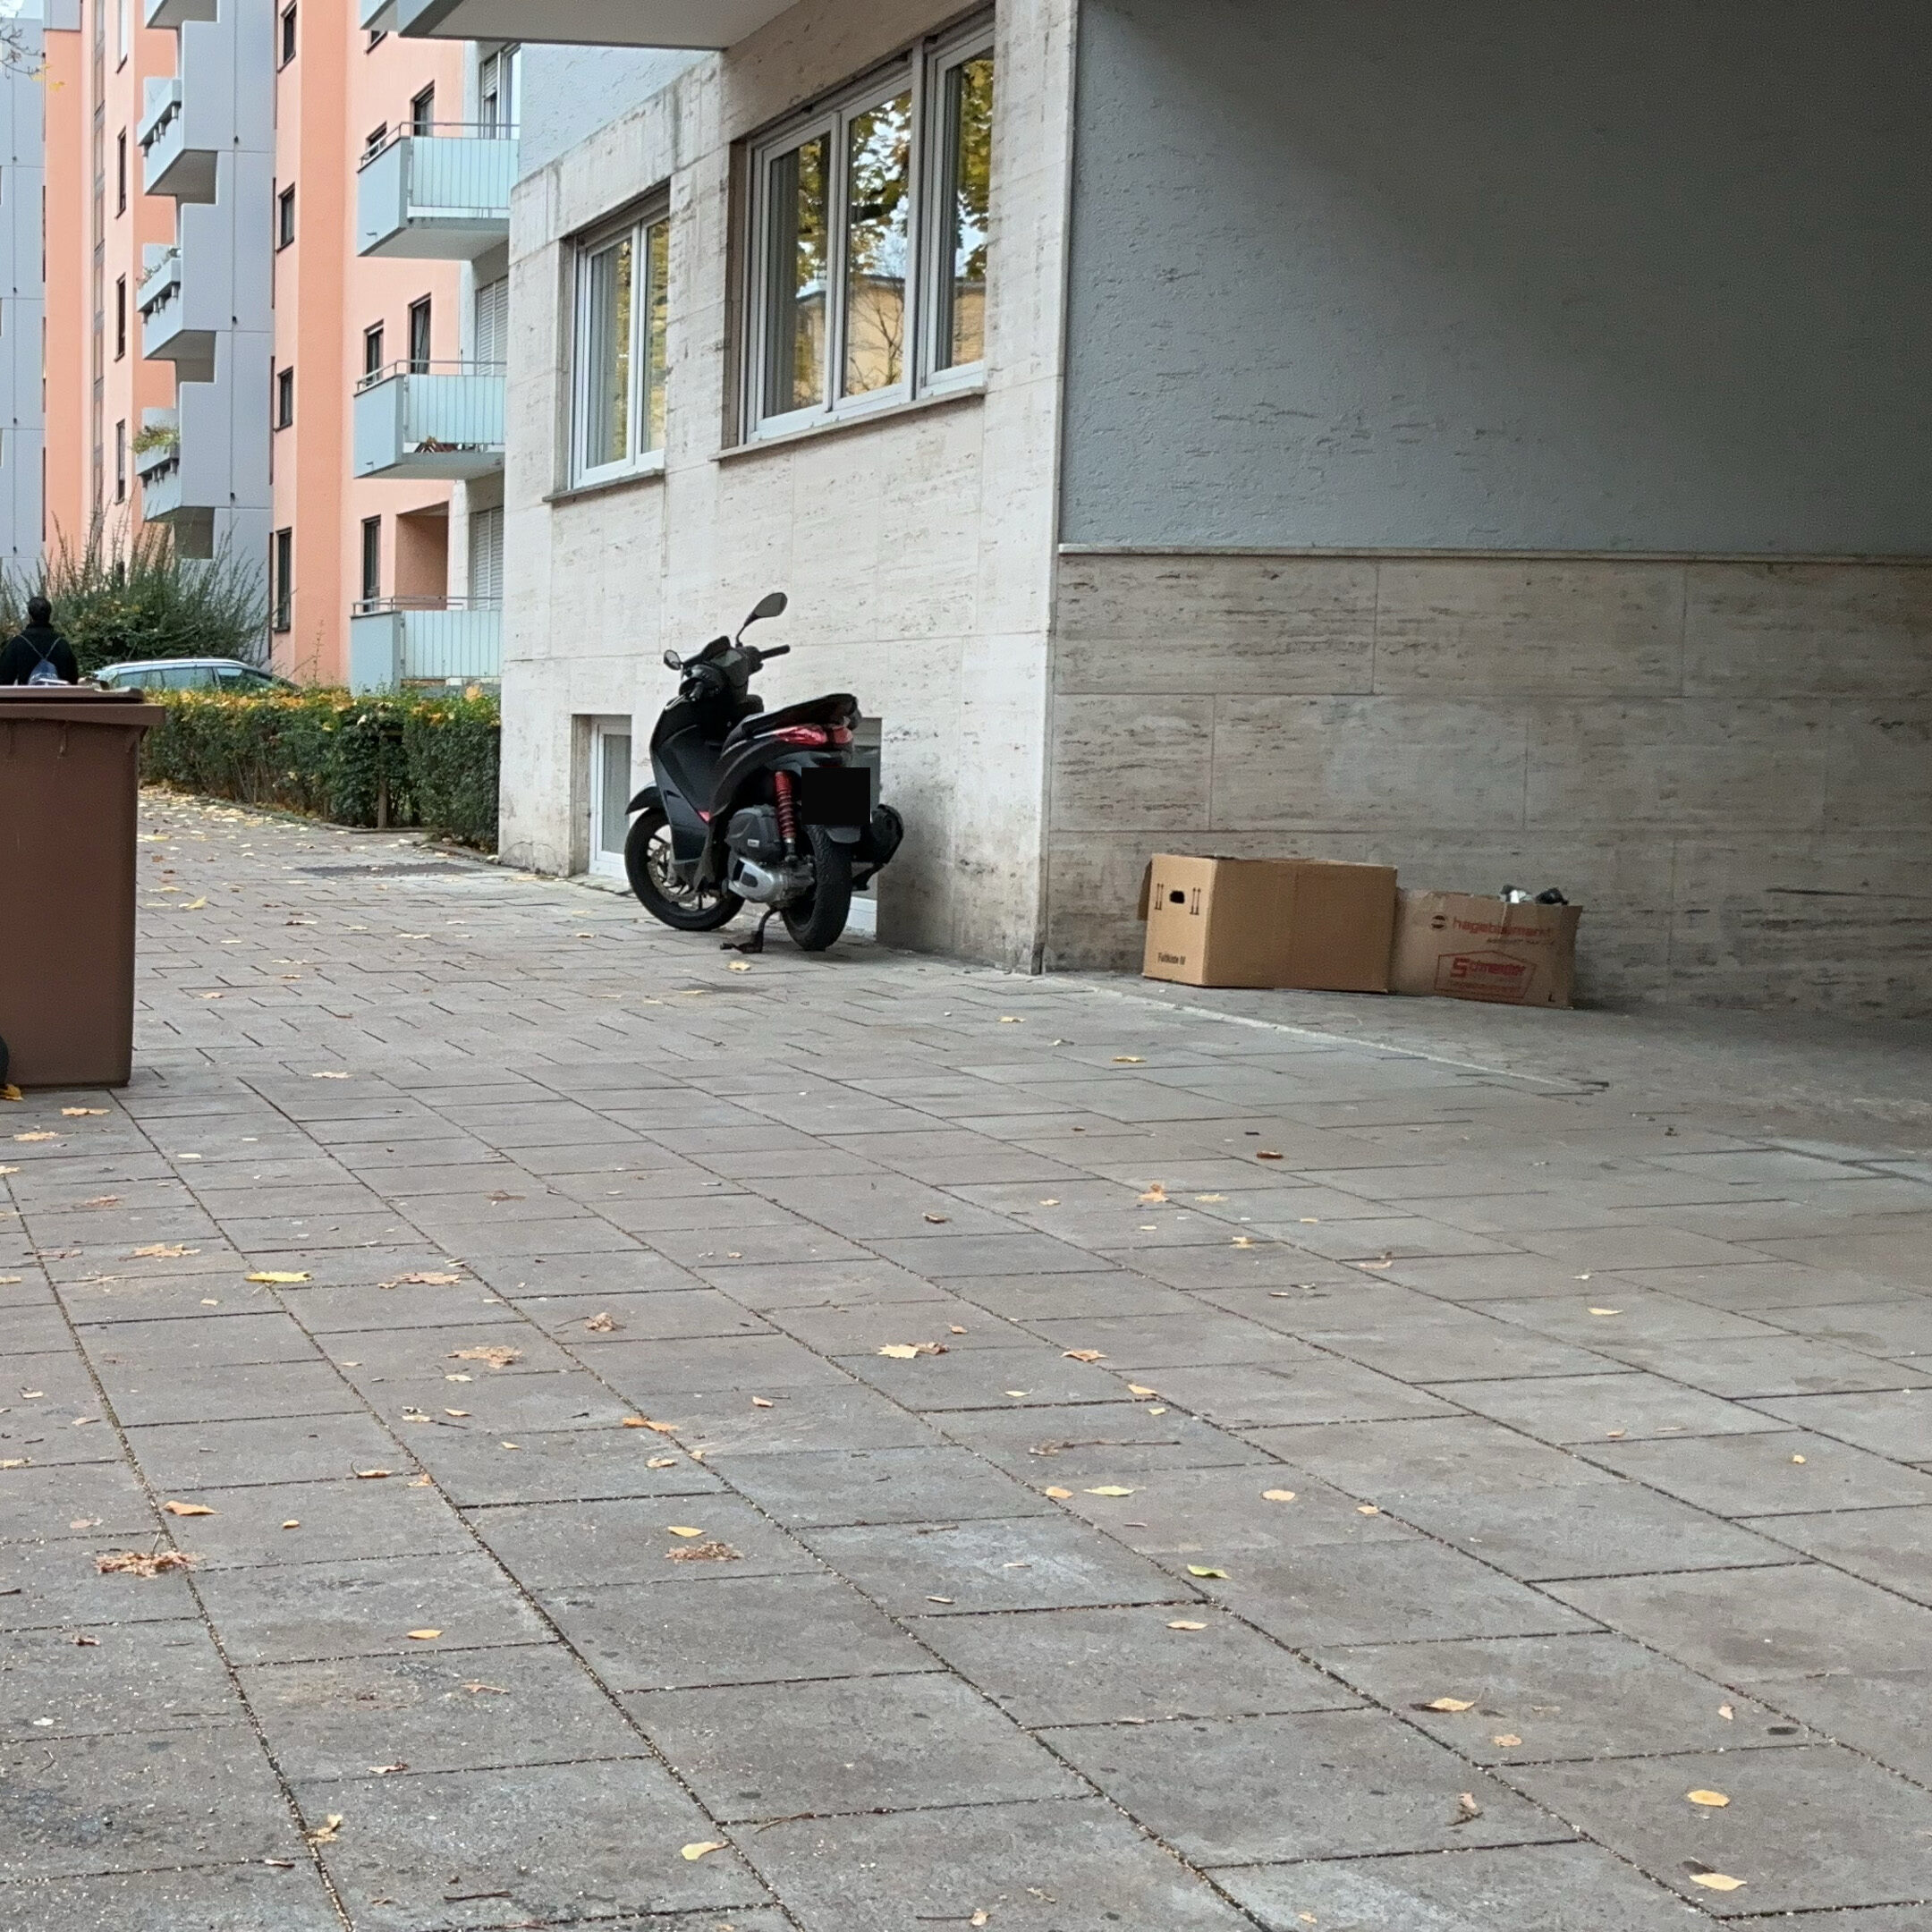
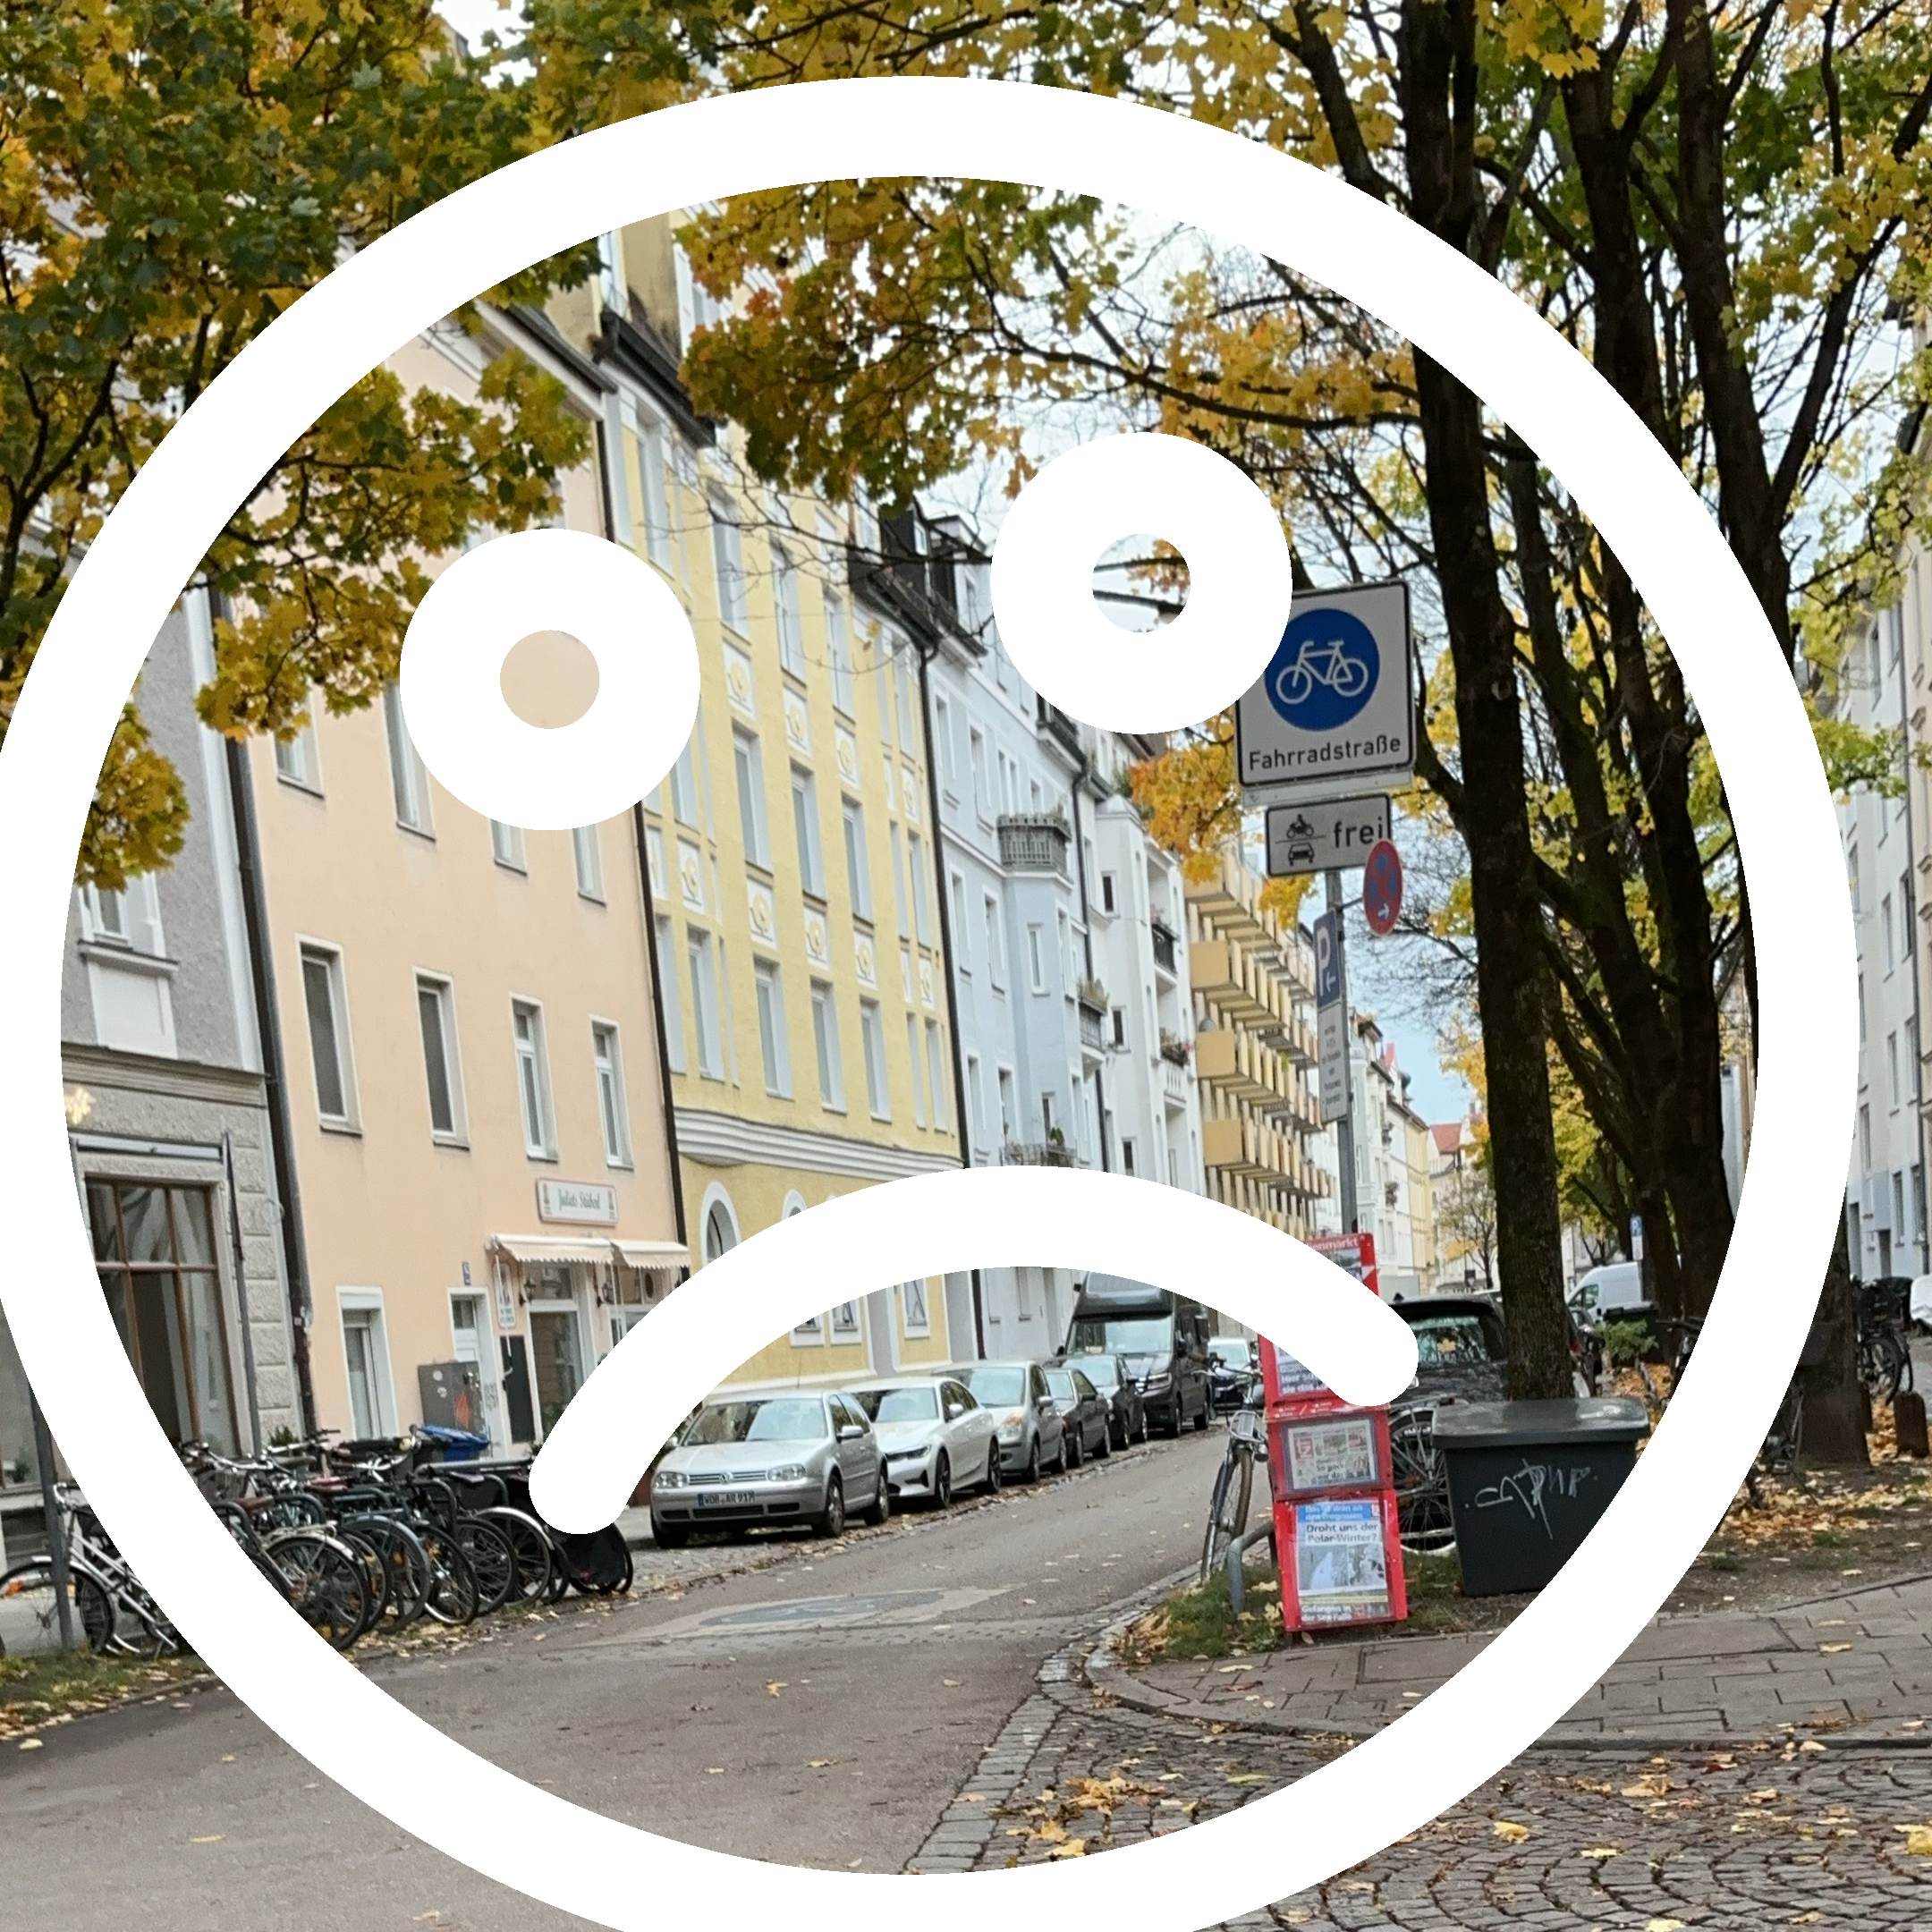
The photo stories took place in Moosach in July 2025 with 18 students from class 5b of the secondary school and in Schwabing-West in October 2025 with 21 students from class 3a of the Farinelli elementary school. Over two mornings each, the children themselves became explorers of their surroundings. They explored their neighborhoods and captured with photos and videos what they liked and what bothered them. Then, together with scientists from the Technical University of Munich, they discussed their needs and wishes. During the group discussions, the children categorized their photos by commonalities – such as the desire for more cleanliness. These discussions were recorded and transcribed by scientists from the Technical University of Munich, and the analysis resulted in six main themes.

On the map, you can view the children's photos and comments at their discovery locations, sorted by the main themes found. A more detailed report on the background of the research format and the themes will soon be available under the series „Mobility and Urban Climate.“.

Select what should and should not be displayed on the map. Click on (i) for more information on the background of the research formats and topics.

Photo SW 65
48.16455/11.57425

Photo SW 64
48.1644/11.56781

Photo SW 63
48.1643/11.56645

Photo SW 62
48.16403/11.56779

Photo SW 61
48.16398/11.56789

Photo SW 60
48.16392/11.56797

Photo SW 59
48.16379/11.57133

Photo SW 58
48.1637/11.5677

SW 57 Photo
48.16352/11.56368

Photo SW 56
48.16347/11.56401

Contact us

Do you have any questions or comments about the project? Then feel free to contact us!

Do you want to join? Then check out  here over.

Questions about the project?
Then take a look at our FAQ over or contact us here.

Would you like to stay up to date?
Then sign up here for updates:

Easy language

What is MOSAIQ?
Imagine something: There is more space for people. The streets have more trees and plants. Everyone can get around better. That's how your Schwabing-West district could be in the future. How would you like your district to be? We want to talk to you about it!

The project is called MOSAIQ. MOSAIQ is a research∙project. MOSAIQ means: Mobility and urban climate in the future city∙part. The Technical University of Munich is leading the project.

What is MOSAIQ about?
MOSAIQ wants to make the streets in the city∙part more beautiful. People should feel comfortable there. There should be more space. For meetings and plants, for example. You can help decide what is tried out in the Stadt∙teil. The ideas come from you. Some ideas will be tried out on the streets for a certain period of time.
The aim of MOSAIQ is to make urban districts good places to live.
At the same time, the climate in the city should improve. And people should be able to move around the city easily. 

What is happening in the district?

  • In the year 2025:
    The people in the district can participate. They can express their ideas. There are discussions, surveys and meetings. Researchers are also starting their work.
  • In the year 2026:
    Some ideas are tried out.
    They are moved around the streets for a certain period of time.
  • In the year 2027:
    The results are evaluated.
    Consideration is given to how things can continue∙.